Hardness Conversion Chart: HRC, HV, HB & Tensile Strength
A hardness conversion chart cross-references the different test standards (HRC, HV, HB, HRA, HRB, HRD), helping engineers grasp material strength and machinability. Converting between Rockwell (HRC), Vickers (HV) and Brinell (HB) judges machinability and estimates tensile strength — widely used in heat treatment, molds, cutting tools and machining, and key to material selection and quality control.
1. What the Chart Is For
A hardness conversion chart is mainly used to convert between hardness standards, compare material strength and judge machinability — common in heat-treatment inspection, mold making and CNC machining.
2. Common Hardness Standards
| Standard | Material | Typical use |
|---|---|---|
| Rockwell HRC | Hard materials | Cutting tools, hardened steel |
| Vickers HV | Broad range, high accuracy | Thin parts, coatings, general |
| Brinell HB | Softer materials | Steel, castings |
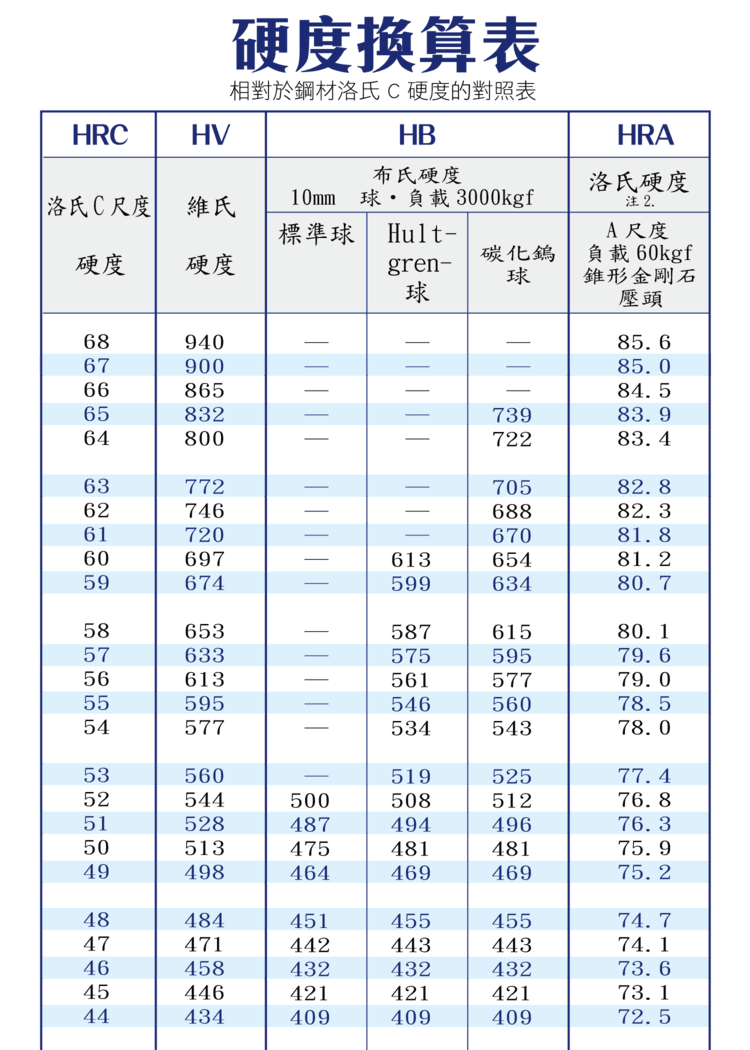
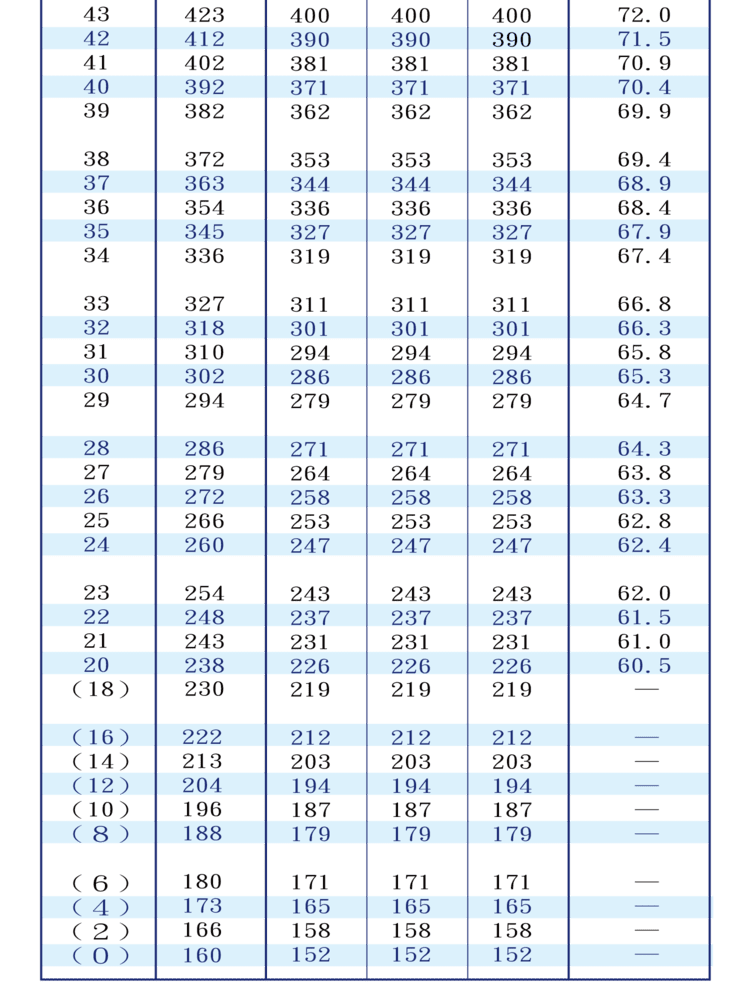
3. HRC / HV / HB Correspondence (reference)
| HRC | HV | HB standard ball | HB Hultgren ball | HB carbide ball | HRA |
|---|---|---|---|---|---|
| 68 | 940 | — | — | — | 85.6 |
| 67 | 900 | — | — | — | 85.0 |
| 66 | 865 | — | — | — | 84.5 |
| 65 | 832 | — | — | 739 | 83.9 |
| 64 | 800 | — | — | 722 | 83.4 |
| 63 | 772 | — | — | 705 | 82.8 |
| 62 | 746 | — | — | 688 | 82.3 |
| 61 | 720 | — | — | 670 | 81.8 |
| 60 | 697 | — | 613 | 654 | 81.2 |
| 59 | 674 | — | 599 | 634 | 80.7 |
| 58 | 653 | — | 587 | 615 | 80.1 |
| 57 | 633 | — | 575 | 595 | 79.6 |
| 56 | 613 | — | 561 | 577 | 79.0 |
| 55 | 595 | — | 546 | 560 | 78.5 |
| 54 | 577 | — | 534 | 543 | 78.0 |
| 53 | 560 | — | 519 | 525 | 77.4 |
| 52 | 544 | 500 | 508 | 512 | 76.8 |
| 51 | 528 | 487 | 494 | 496 | 76.3 |
| 50 | 513 | 475 | 481 | 481 | 75.9 |
| 49 | 498 | 464 | 469 | 469 | 75.2 |
| 48 | 484 | 451 | 455 | 455 | 74.7 |
| 47 | 471 | 442 | 443 | 443 | 74.1 |
| 46 | 458 | 432 | 432 | 432 | 73.6 |
| 45 | 446 | 421 | 421 | 421 | 73.1 |
| 44 | 434 | 409 | 409 | 409 | 72.5 |
| 43 | 423 | 400 | 400 | 400 | 72.0 |
| 42 | 412 | 390 | 390 | 390 | 71.5 |
| 41 | 402 | 381 | 381 | 381 | 70.9 |
| 40 | 392 | 371 | 371 | 371 | 70.4 |
| 39 | 382 | 362 | 362 | 362 | 69.9 |
| 38 | 372 | 353 | 353 | 353 | 69.4 |
| 37 | 363 | 344 | 344 | 344 | 68.9 |
| 36 | 354 | 336 | 336 | 336 | 68.4 |
| 35 | 345 | 327 | 327 | 327 | 67.9 |
| 34 | 336 | 319 | 319 | 319 | 67.4 |
| 33 | 327 | 311 | 311 | 311 | 66.8 |
| 32 | 318 | 301 | 301 | 301 | 66.3 |
| 31 | 310 | 294 | 294 | 294 | 65.8 |
| 30 | 302 | 286 | 286 | 286 | 65.3 |
| 29 | 294 | 279 | 279 | 279 | 64.7 |
| 28 | 286 | 271 | 271 | 271 | 64.3 |
| 27 | 279 | 264 | 264 | 264 | 63.8 |
| 26 | 272 | 258 | 258 | 258 | 63.3 |
| 25 | 266 | 253 | 253 | 253 | 62.8 |
| 24 | 260 | 247 | 247 | 247 | 62.4 |
| 23 | 254 | 243 | 243 | 243 | 62.0 |
| 22 | 248 | 237 | 237 | 237 | 61.5 |
| 21 | 243 | 231 | 231 | 231 | 61.0 |
| 20 | 238 | 226 | 226 | 226 | 60.5 |
| (18) | 230 | 219 | 219 | 219 | — |
| (16) | 222 | 212 | 212 | 212 | — |
| (14) | 213 | 203 | 203 | 203 | — |
| (12) | 204 | 194 | 194 | 194 | — |
| (10) | 196 | 187 | 187 | 187 | — |
| (8) | 188 | 179 | 179 | 179 | — |
| (6) | 180 | 171 | 171 | 171 | — |
| (4) | 173 | 165 | 165 | 165 | — |
| (2) | 166 | 158 | 158 | 158 | — |
| (0) | 160 | 152 | 152 | 152 | — |
Higher HRC means a harder material; HV and HB cross-reference each other. The table above lists every step from HRC 68 down to (0); bracketed values are outside normal use. Its values come from ASTM E140 Table 3 (SAE-ASM-ASTM) and from approximations per the JIS Z 8413 and Z 8438 conversion tables, without marking which cell comes from which; where an authoritative value is needed, go to those standards. One HRC maps to three Brinell indenters (standard ball, Hultgren ball, carbide ball), so check which indenter was used before reading a value.
Heat treatment can leave the surface and core of the same part far apart in hardness. The table lists typical HRC ranges for common steels by heat-treatment state (bracketed values are outside the normal HRC range):
| Material and heat treatment | HRC range |
|---|---|
| S45C, soft nitrided | 62~57 |
| SCM415, carburized and quenched | 60~54 |
| SCM440, induction hardened | 57~49 |
| S45C, induction hardened | 53~47 |
| SCM415, core | 34~32 |
| S45C, quenched and tempered | 27~20 |
| SCM440, core | 27~20 |
| S45C, core | (12)~(4) |
| SUS303 | (10)~(0) |
So on one S45C part, the soft-nitrided surface is HRC 57–62 while the core is only about (4)–(12), a gap of more than 50 HRC, and cutting conditions should change with depth; actual values still vary with case depth and tempering.
4. Other Rockwell Scales
| Scale | Load | Use |
|---|---|---|
| HRA | 60 kgf | Super-hard materials (carbide) |
| HRB | 100 kgf | Mild steel, copper |
| HRD | 100 kgf | Medium-high hardness |
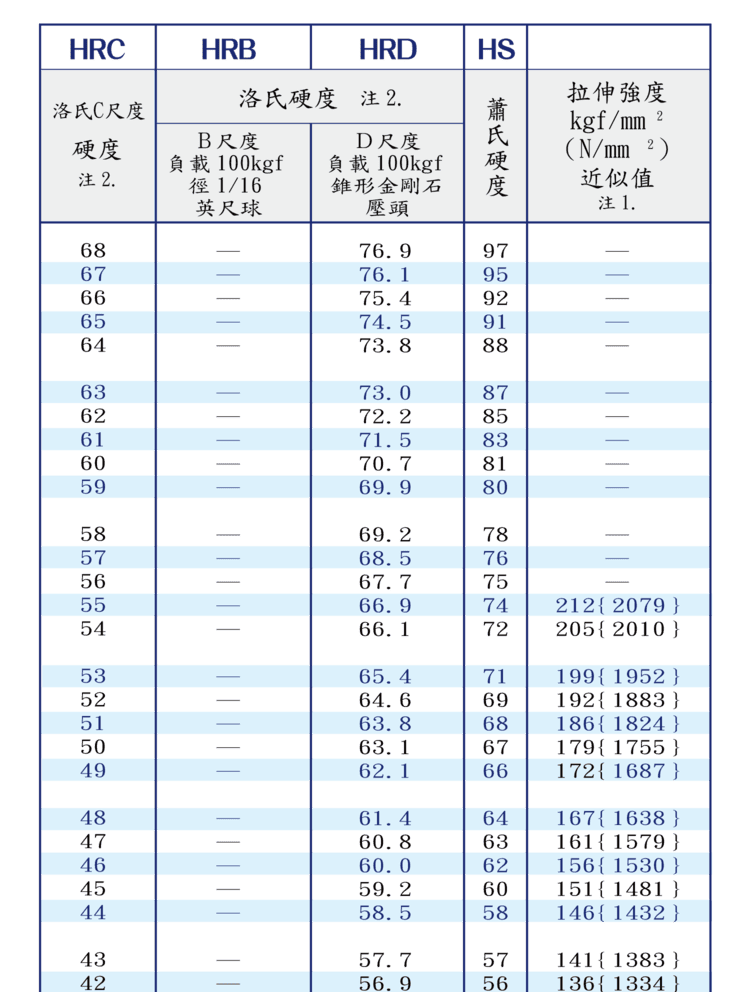
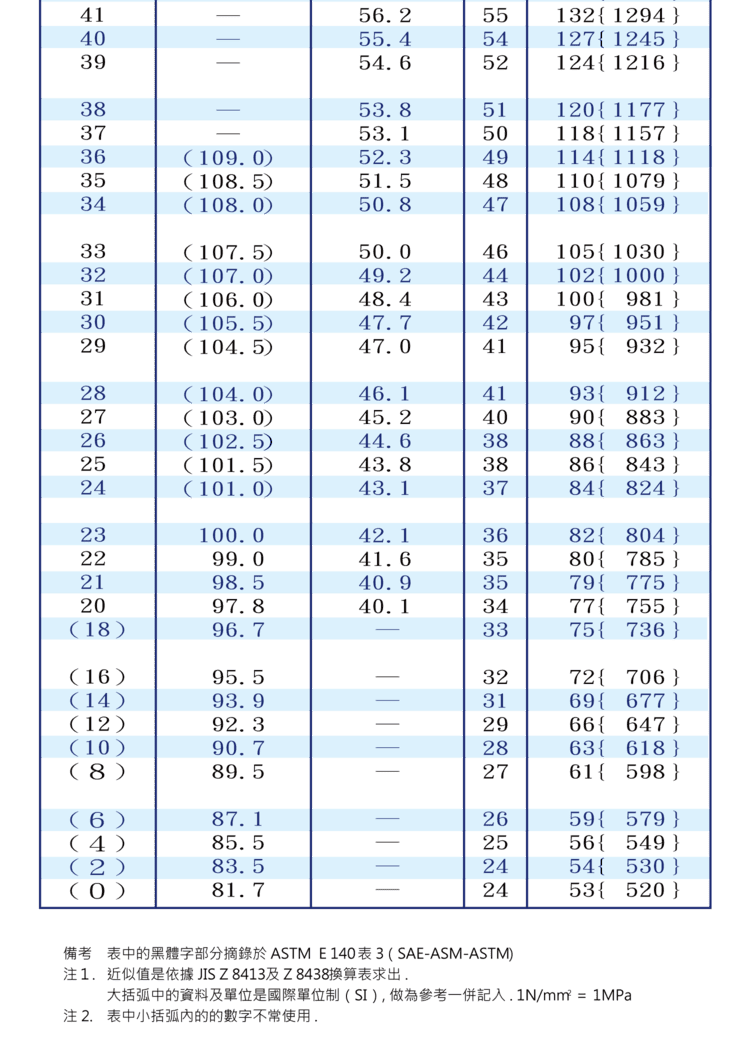
The table below lists the other Rockwell scales and Shore hardness from the same source chart, step by step. Bracketed HRB values are outside normal use.
| HRC | HRB | HRD | HS (Shore) |
|---|---|---|---|
| 68 | — | 76.9 | 97 |
| 67 | — | 76.1 | 95 |
| 66 | — | 75.4 | 92 |
| 65 | — | 74.5 | 91 |
| 64 | — | 73.8 | 88 |
| 63 | — | 73.0 | 87 |
| 62 | — | 72.2 | 85 |
| 61 | — | 71.5 | 83 |
| 60 | — | 70.7 | 81 |
| 59 | — | 69.9 | 80 |
| 58 | — | 69.2 | 78 |
| 57 | — | 68.5 | 76 |
| 56 | — | 67.7 | 75 |
| 55 | — | 66.9 | 74 |
| 54 | — | 66.1 | 72 |
| 53 | — | 65.4 | 71 |
| 52 | — | 64.6 | 69 |
| 51 | — | 63.8 | 68 |
| 50 | — | 63.1 | 67 |
| 49 | — | 62.1 | 66 |
| 48 | — | 61.4 | 64 |
| 47 | — | 60.8 | 63 |
| 46 | — | 60.0 | 62 |
| 45 | — | 59.2 | 60 |
| 44 | — | 58.5 | 58 |
| 43 | — | 57.7 | 57 |
| 42 | — | 56.9 | 56 |
| 41 | — | 56.2 | 55 |
| 40 | — | 55.4 | 54 |
| 39 | — | 54.6 | 52 |
| 38 | — | 53.8 | 51 |
| 37 | — | 53.1 | 50 |
| 36 | (109.0) | 52.3 | 49 |
| 35 | (108.5) | 51.5 | 48 |
| 34 | (108.0) | 50.8 | 47 |
| 33 | (107.5) | 50.0 | 46 |
| 32 | (107.0) | 49.2 | 44 |
| 31 | (106.0) | 48.4 | 43 |
| 30 | (105.5) | 47.7 | 42 |
| 29 | (104.5) | 47.0 | 41 |
| 28 | (104.0) | 46.1 | 41 |
| 27 | (103.0) | 45.2 | 40 |
| 26 | (102.5) | 44.6 | 38 |
| 25 | (101.5) | 43.8 | 38 |
| 24 | (101.0) | 43.1 | 37 |
| 23 | 100.0 | 42.1 | 36 |
| 22 | 99.0 | 41.6 | 35 |
| 21 | 98.5 | 40.9 | 35 |
| 20 | 97.8 | 40.1 | 34 |
| (18) | 96.7 | — | 33 |
| (16) | 95.5 | — | 32 |
| (14) | 93.9 | — | 31 |
| (12) | 92.3 | — | 29 |
| (10) | 90.7 | — | 28 |
| (8) | 89.5 | — | 27 |
| (6) | 87.1 | — | 26 |
| (4) | 85.5 | — | 25 |
| (2) | 83.5 | — | 24 |
| (0) | 81.7 | — | 24 |
5. Hardness vs Tensile Strength (reference)
| HRC | Tensile (kgf/mm²) | Tensile (N/mm² = MPa) |
|---|---|---|
| 55 | 212 | 2079 |
| 54 | 205 | 2010 |
| 53 | 199 | 1952 |
| 52 | 192 | 1883 |
| 51 | 186 | 1824 |
| 50 | 179 | 1755 |
| 49 | 172 | 1687 |
| 48 | 167 | 1638 |
| 47 | 161 | 1579 |
| 46 | 156 | 1530 |
| 45 | 151 | 1481 |
| 44 | 146 | 1432 |
| 43 | 141 | 1383 |
| 42 | 136 | 1334 |
| 41 | 132 | 1294 |
| 40 | 127 | 1245 |
| 39 | 124 | 1216 |
| 38 | 120 | 1177 |
| 37 | 118 | 1157 |
| 36 | 114 | 1118 |
| 35 | 110 | 1079 |
| 34 | 108 | 1059 |
| 33 | 105 | 1030 |
| 32 | 102 | 1000 |
| 31 | 100 | 981 |
| 30 | 97 | 951 |
| 29 | 95 | 932 |
| 28 | 93 | 912 |
| 27 | 90 | 883 |
| 26 | 88 | 863 |
| 25 | 86 | 843 |
| 24 | 84 | 824 |
| 23 | 82 | 804 |
| 22 | 80 | 785 |
| 21 | 79 | 775 |
| 20 | 77 | 755 |
| (18) | 75 | 736 |
| (16) | 72 | 706 |
| (14) | 69 | 677 |
| (12) | 66 | 647 |
| (10) | 63 | 618 |
| (8) | 61 | 598 |
| (6) | 59 | 579 |
| (4) | 56 | 549 |
| (2) | 54 | 530 |
| (0) | 53 | 520 |
Tensile estimates for the same HRC differ between sources: according to Hitachi technical data, HV 500 (about HRC 49.1) corresponds to about 1750 MPa, while this table gives 1687 MPa at HRC 49. Both are approximations and must not be used for material acceptance — that takes an actual tensile test.
Tensile values are listed up to HRC 55 only. This only approximates carbon/alloy steels. For unit conversion (kgf/mm², MPa) see the SI Unit Conversion Guide.
6. Hardness and Machining
Higher hardness means higher cutting resistance. Rule: hard materials use a low feed with wear-resistant tools (carbide, coated); softer materials allow high-speed machining. Confirming hardness before machining helps set conditions and estimate tool life.
7. Notes on Use
Conversions are approximate; different materials vary with microstructure, heat treatment and test conditions. Formal specs should be measured directly with the named hardness standard, not taken from converted values.
FAQ
Q: Can HRC and HV be converted directly?
Approximately (e.g. HRC 60 ≈ HV 697), but it is an estimate. Because the principles differ (Rockwell measures depth, Vickers measures area), materials vary; for precision, measure directly with the named standard. See Hardness Testing Guide: Vickers, Rockwell & Knoop for details.
Q: Which of HRC, HV, HB should I use?
By hardness and part: hard (hardened steel, tools) use HRC; thin parts, coatings or high precision use HV; softer steel and castings use HB. Super-hard materials like carbide often use HRA.
Q: Can hardness estimate tensile strength?
For carbon/alloy steel it approximates (e.g. HRC 50 ≈ 179 kgf/mm² ≈ 1755 MPa), but it's only a reference. Stainless, cast iron and non-ferrous metals differ; critical designs should use an actual tensile test.
Q: Is higher hardness always better?
Not necessarily. Higher hardness is more wear-resistant and stronger, but toughness usually drops and it becomes brittle. Balance hardness and toughness by use, and note over-hard material needs low feed and wear-resistant tools, raising cost.
Published: 2026-03-25 | Last updated: 2026-10-17