QC & SPC Guide: Cp, Cpk and Control Charts
Quality control (QC) ensures products meet spec and customer needs; statistical process control (SPC) monitors process stability through data analysis and control charts. This guide covers population, sample, bias and variation, and explains the Cp and Cpk capability indices and control-chart rules to raise quality stability and cut defect rates.
1. Core QC Concepts
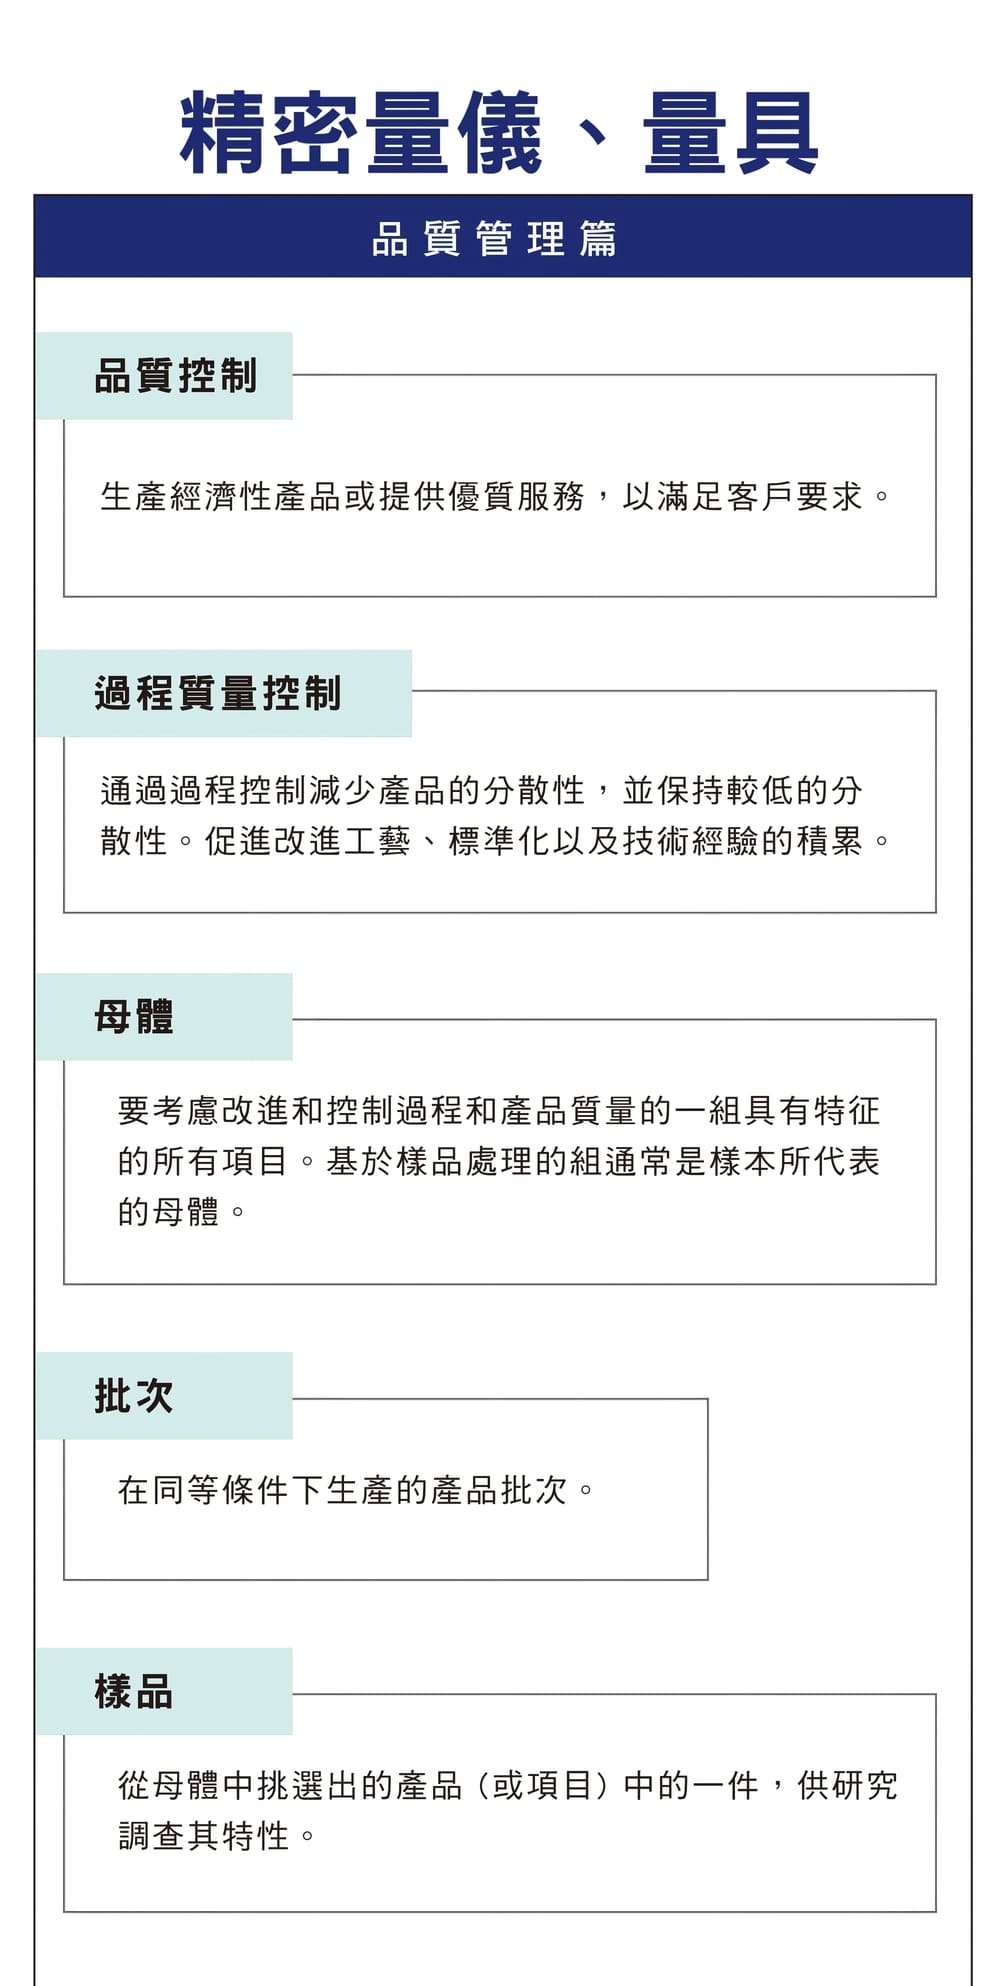
QC aims to supply in-spec products, meet customer needs and cut defects and cost. The key is a stable process and low variation; data and statistics reduce dispersion, hold quality steady and drive standardisation and continuous improvement — the core of modern manufacturing quality management.
2. Population, Lot and Sample
| Term | Definition |
|---|---|
| Population | All representative products |
| Lot | A group made under the same conditions |
| Sample | A part drawn from the population to analyse |
3. Bias and Variation (Accuracy Core)
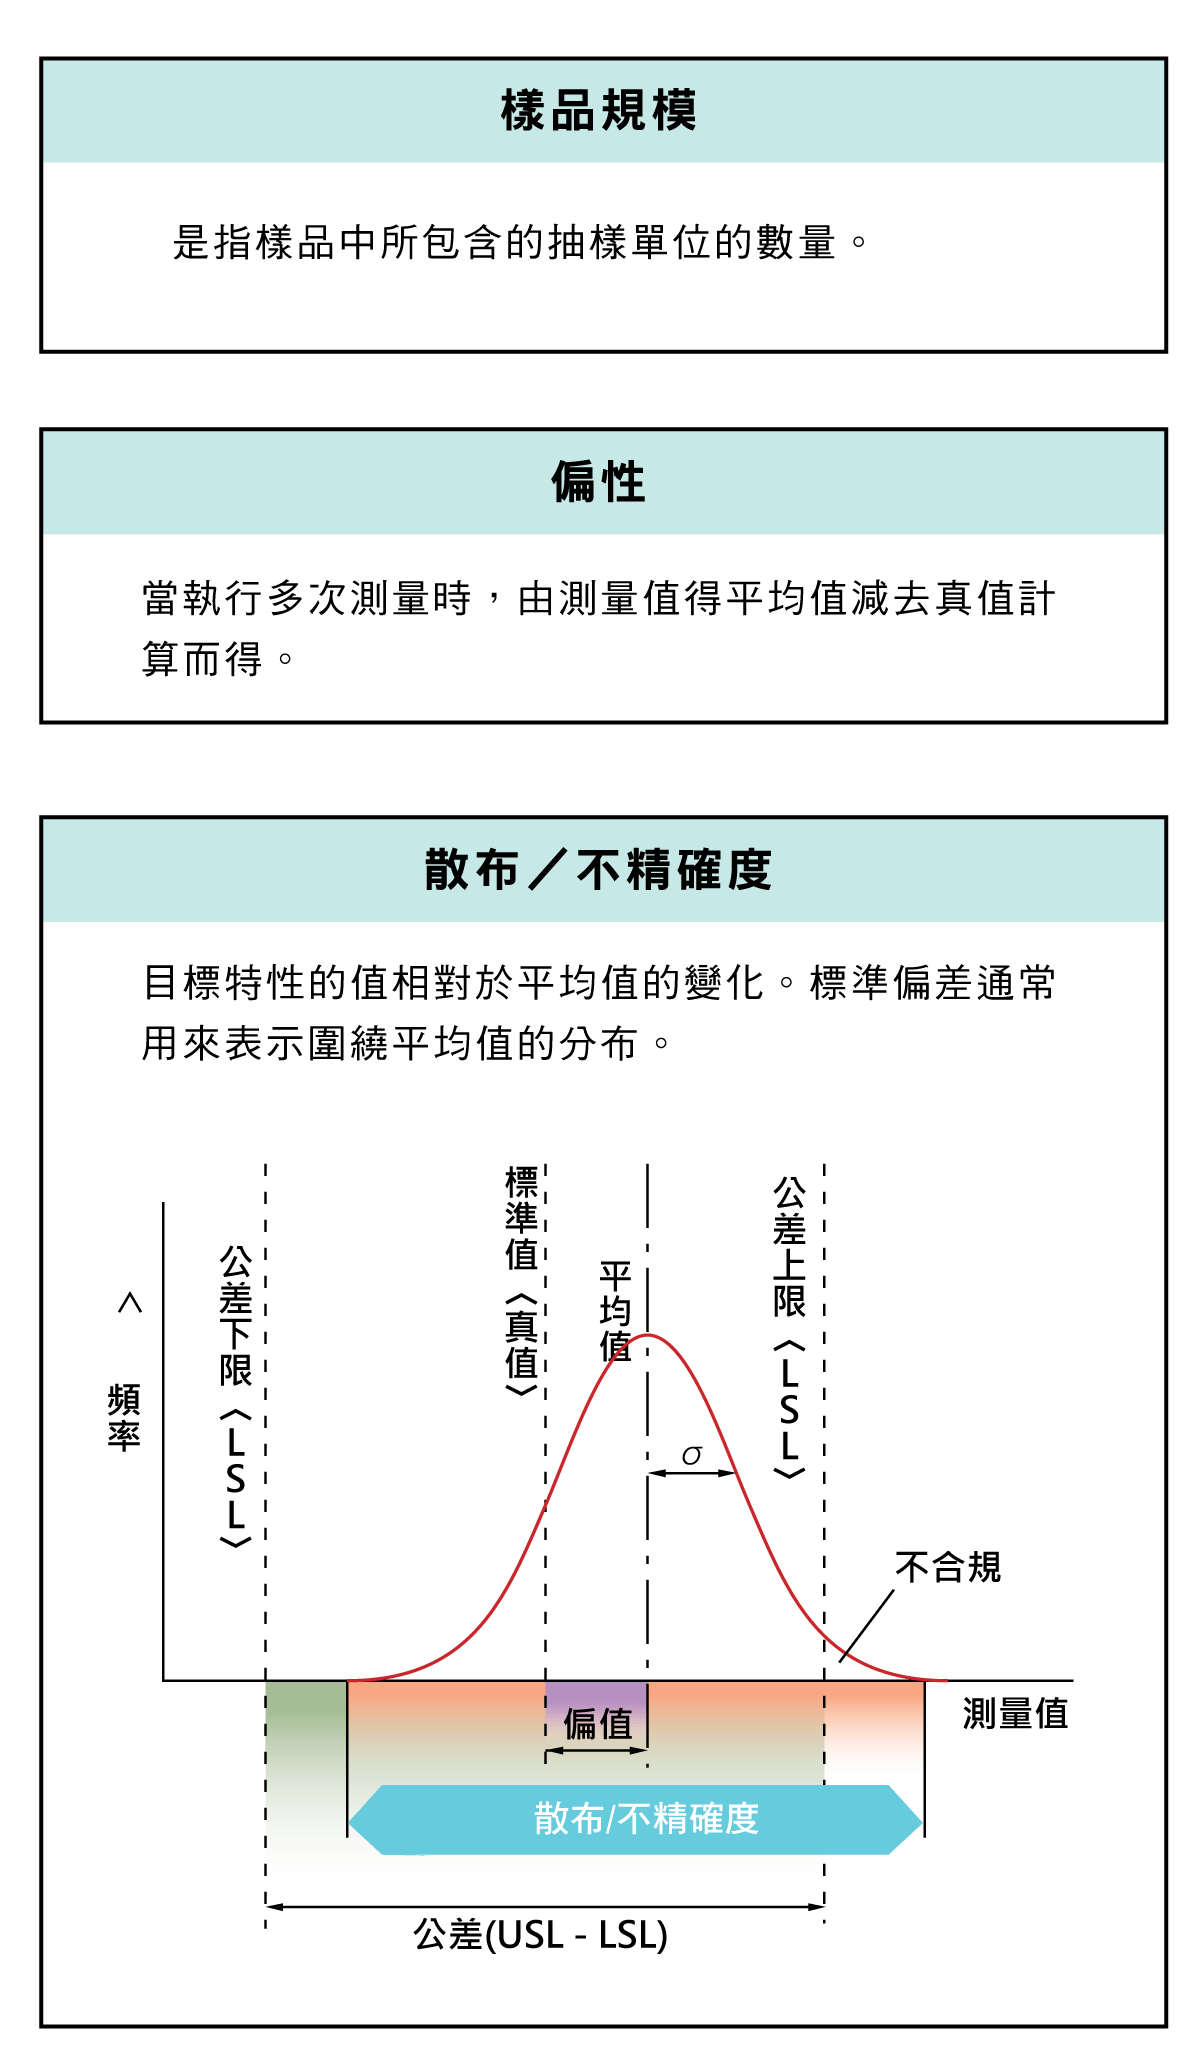
Quality error comes from two directions: bias — the result deviates from target; variation (imprecision) — the spread of data. The ideal is small bias and small spread.
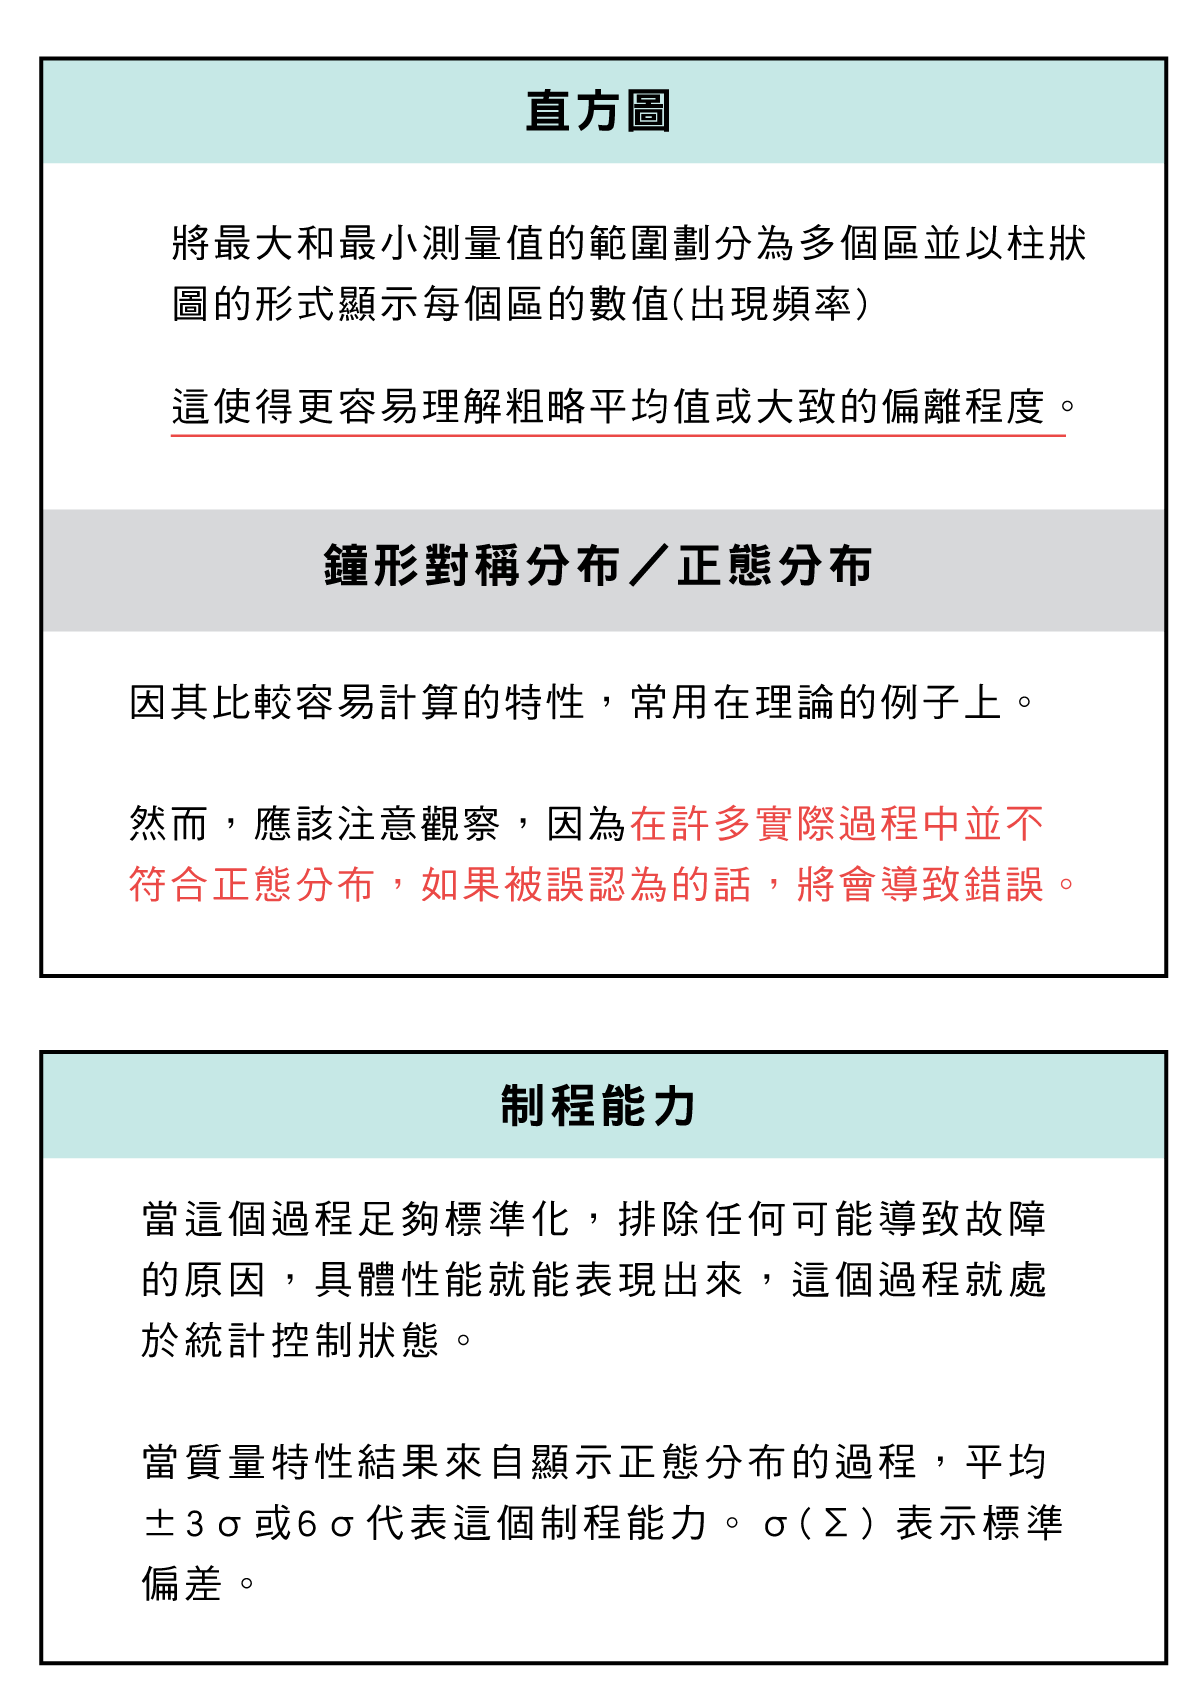
4. Normal Distribution
Most processes are assumed bell-shaped (normal): mean at centre, data symmetric. In practice it is not always fully normal, and misjudging leads to wrong decisions, so confirm the distribution shape before applying the indices.
5. Process Capability and Cp
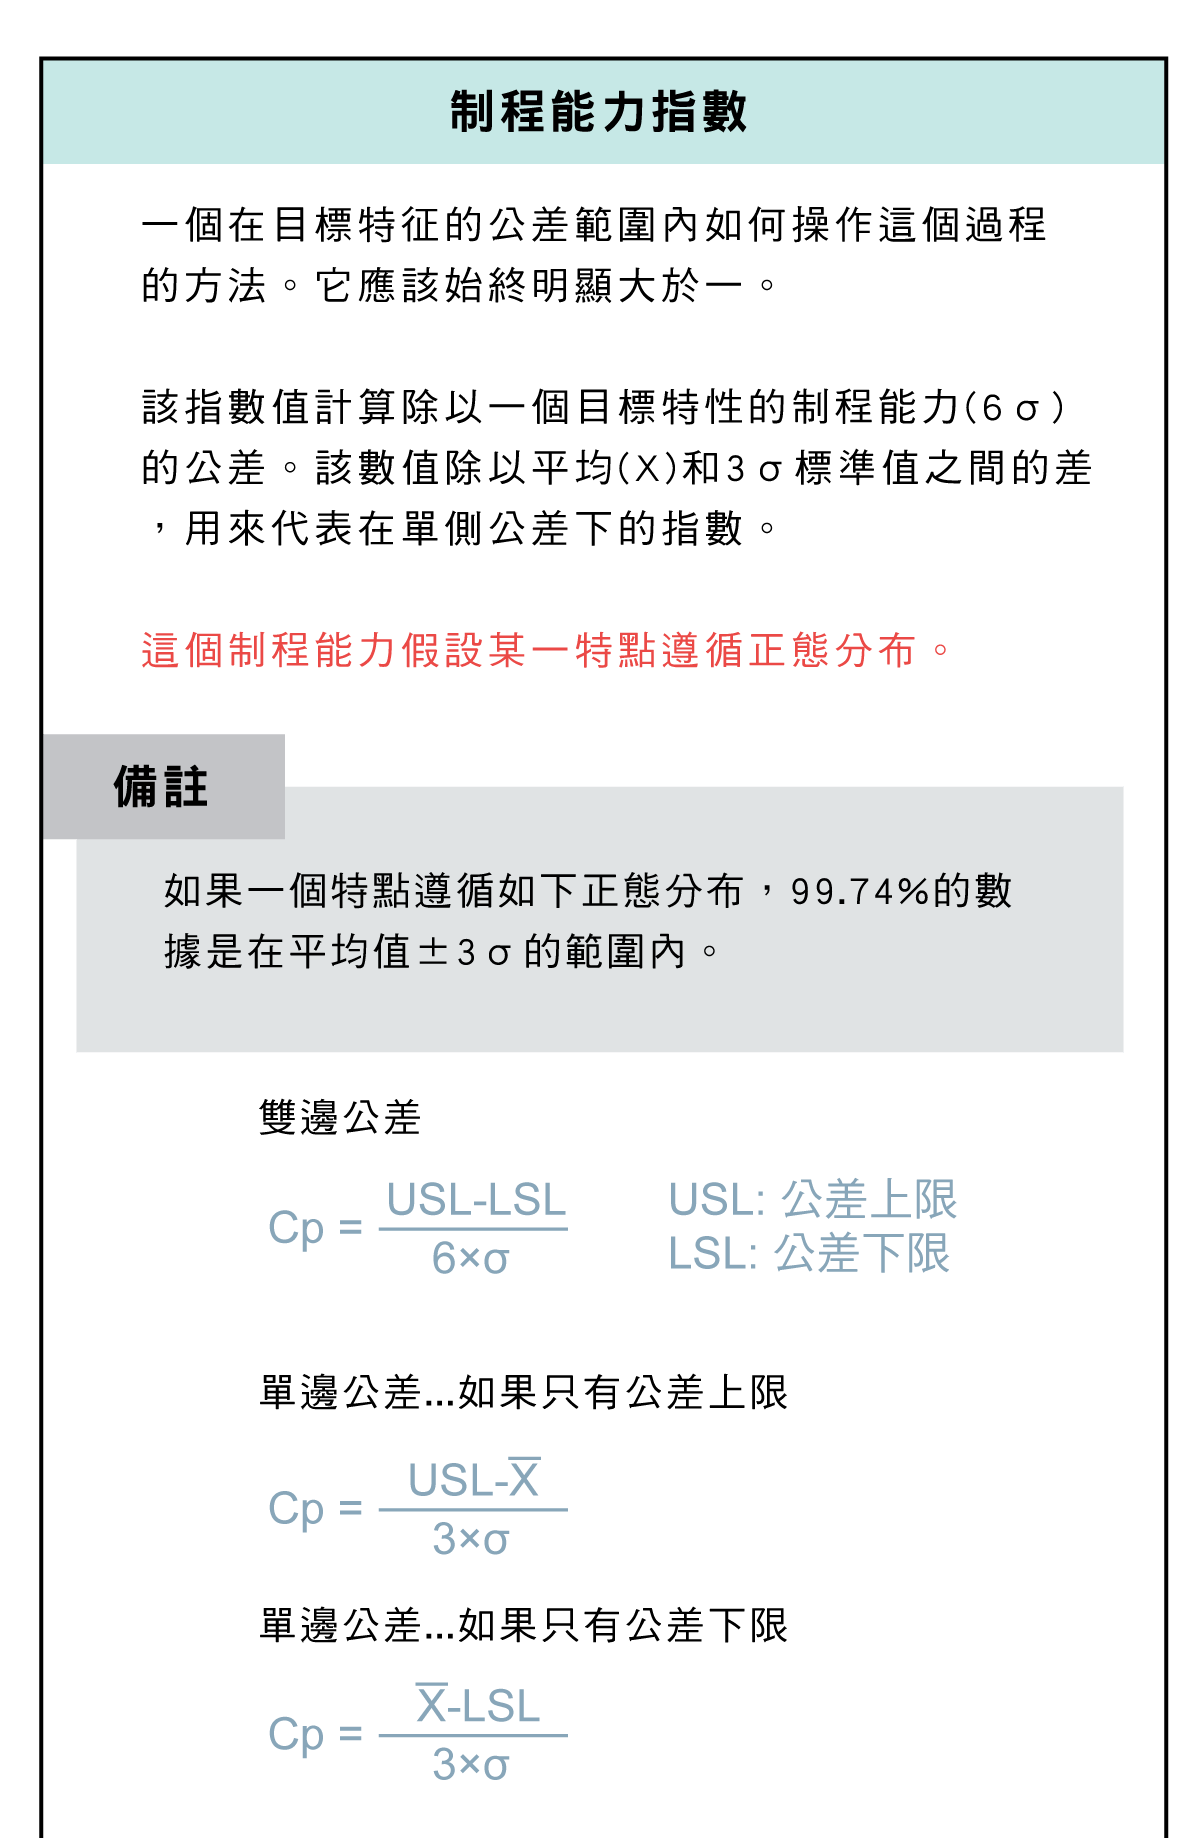
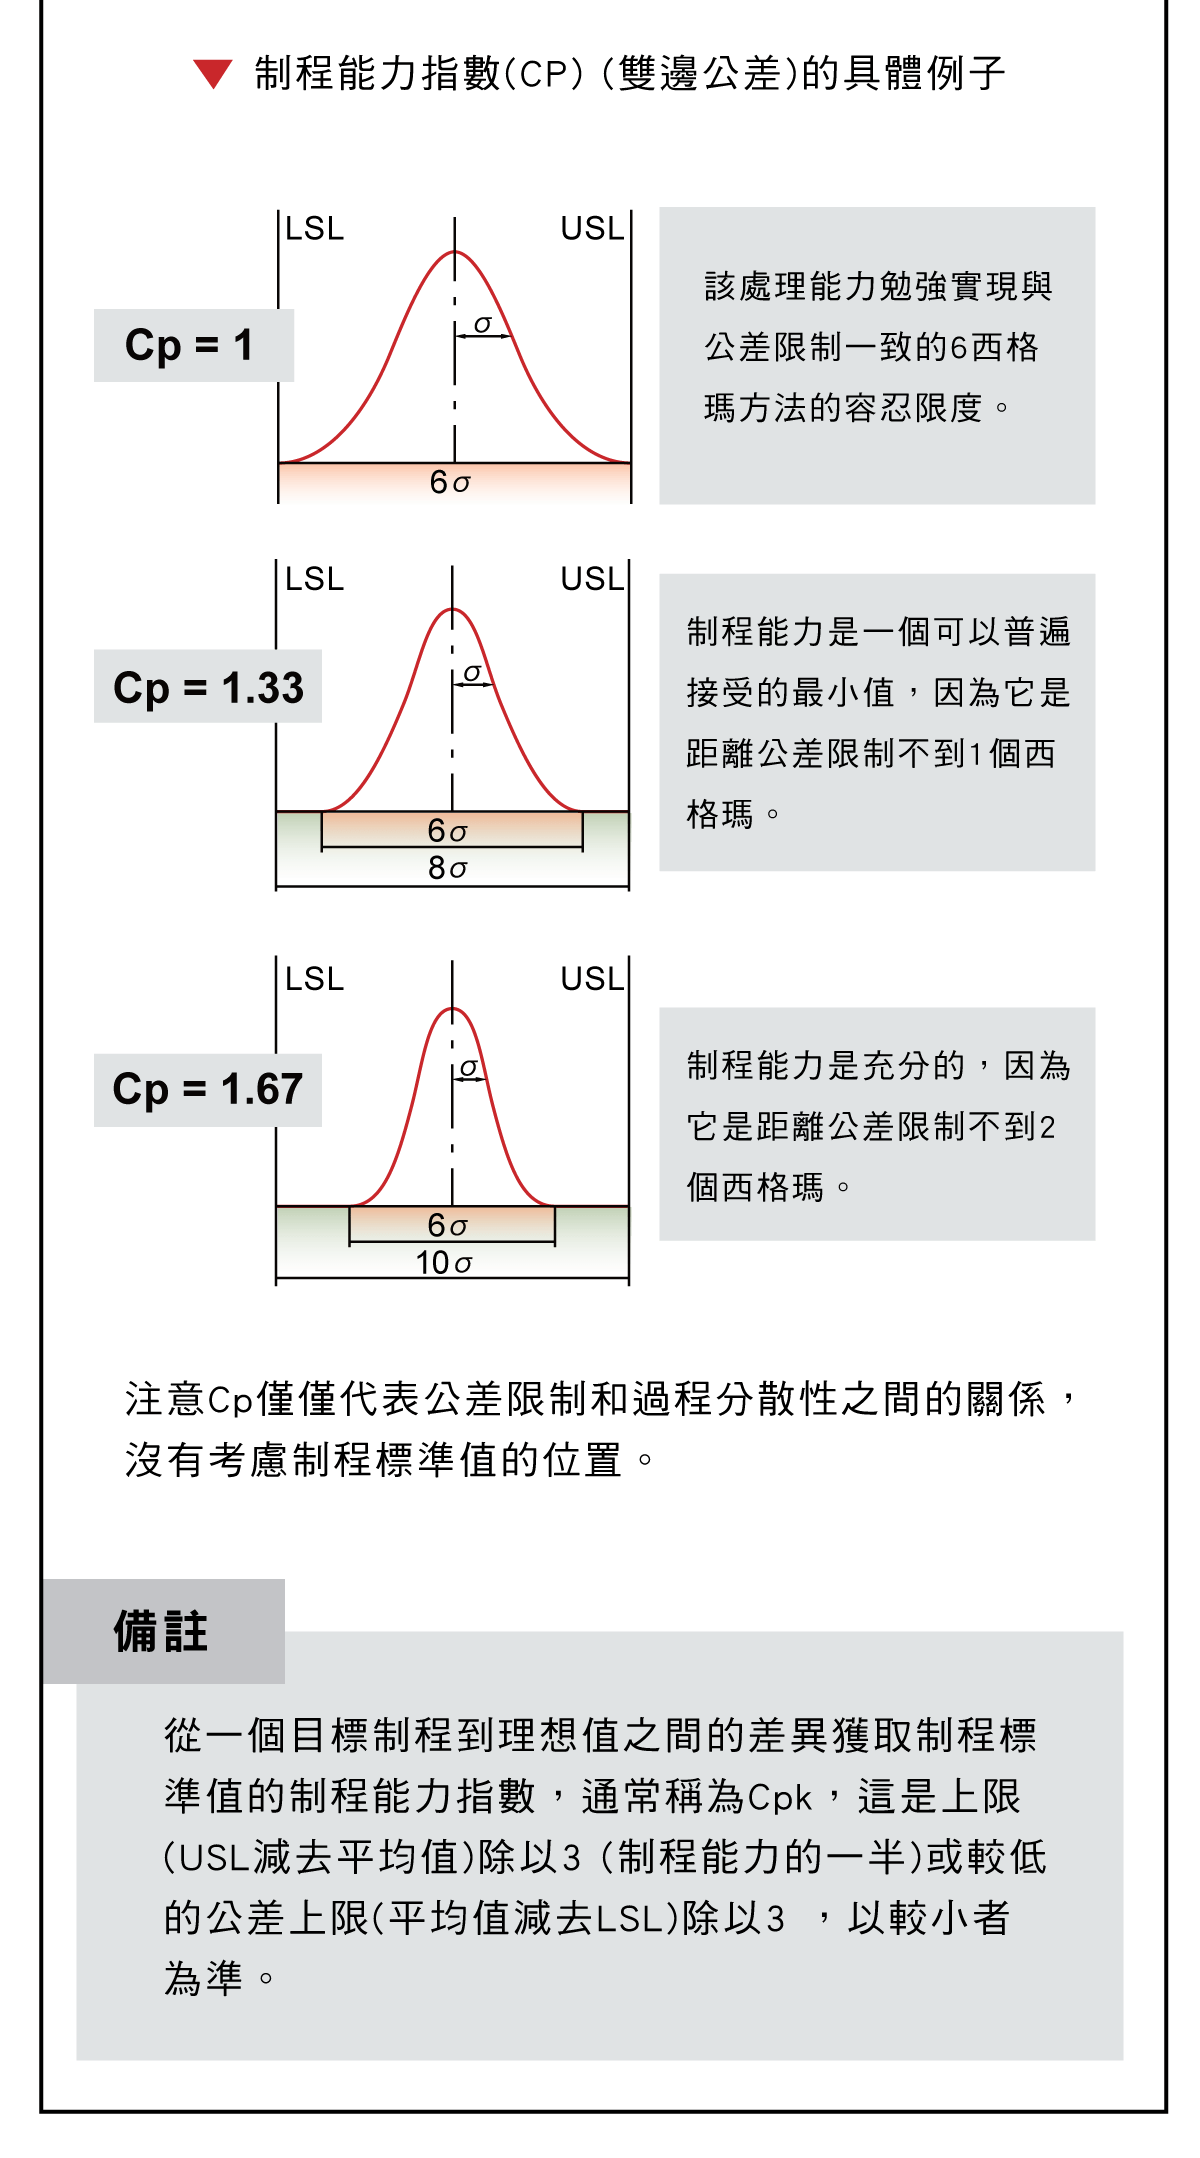
Process capability is how well a process meets tolerance — "distribution width vs tolerance range". Cp is the potential capability:
| Item | Content |
|---|---|
| Formula | Cp = (USL − LSL) / 6σ |
| Cp = 1 | Barely meets |
| Cp ≥ 1.33 | Acceptable |
| Cp ≥ 1.67 | Good |
USL upper spec, LSL lower spec, σ standard deviation.
6. Cpk Capability Index
Cpk accounts for distribution shift, closer to reality than Cp:
Cpk = min[(USL − X̄) / 3σ, (X̄ − LSL) / 3σ]
X̄ is the mean. When the distribution shifts to one side, Cpk falls below Cp; the same ≥1.33 acceptable and ≥1.67 good thresholds generally apply.
7. Control-Chart Rules
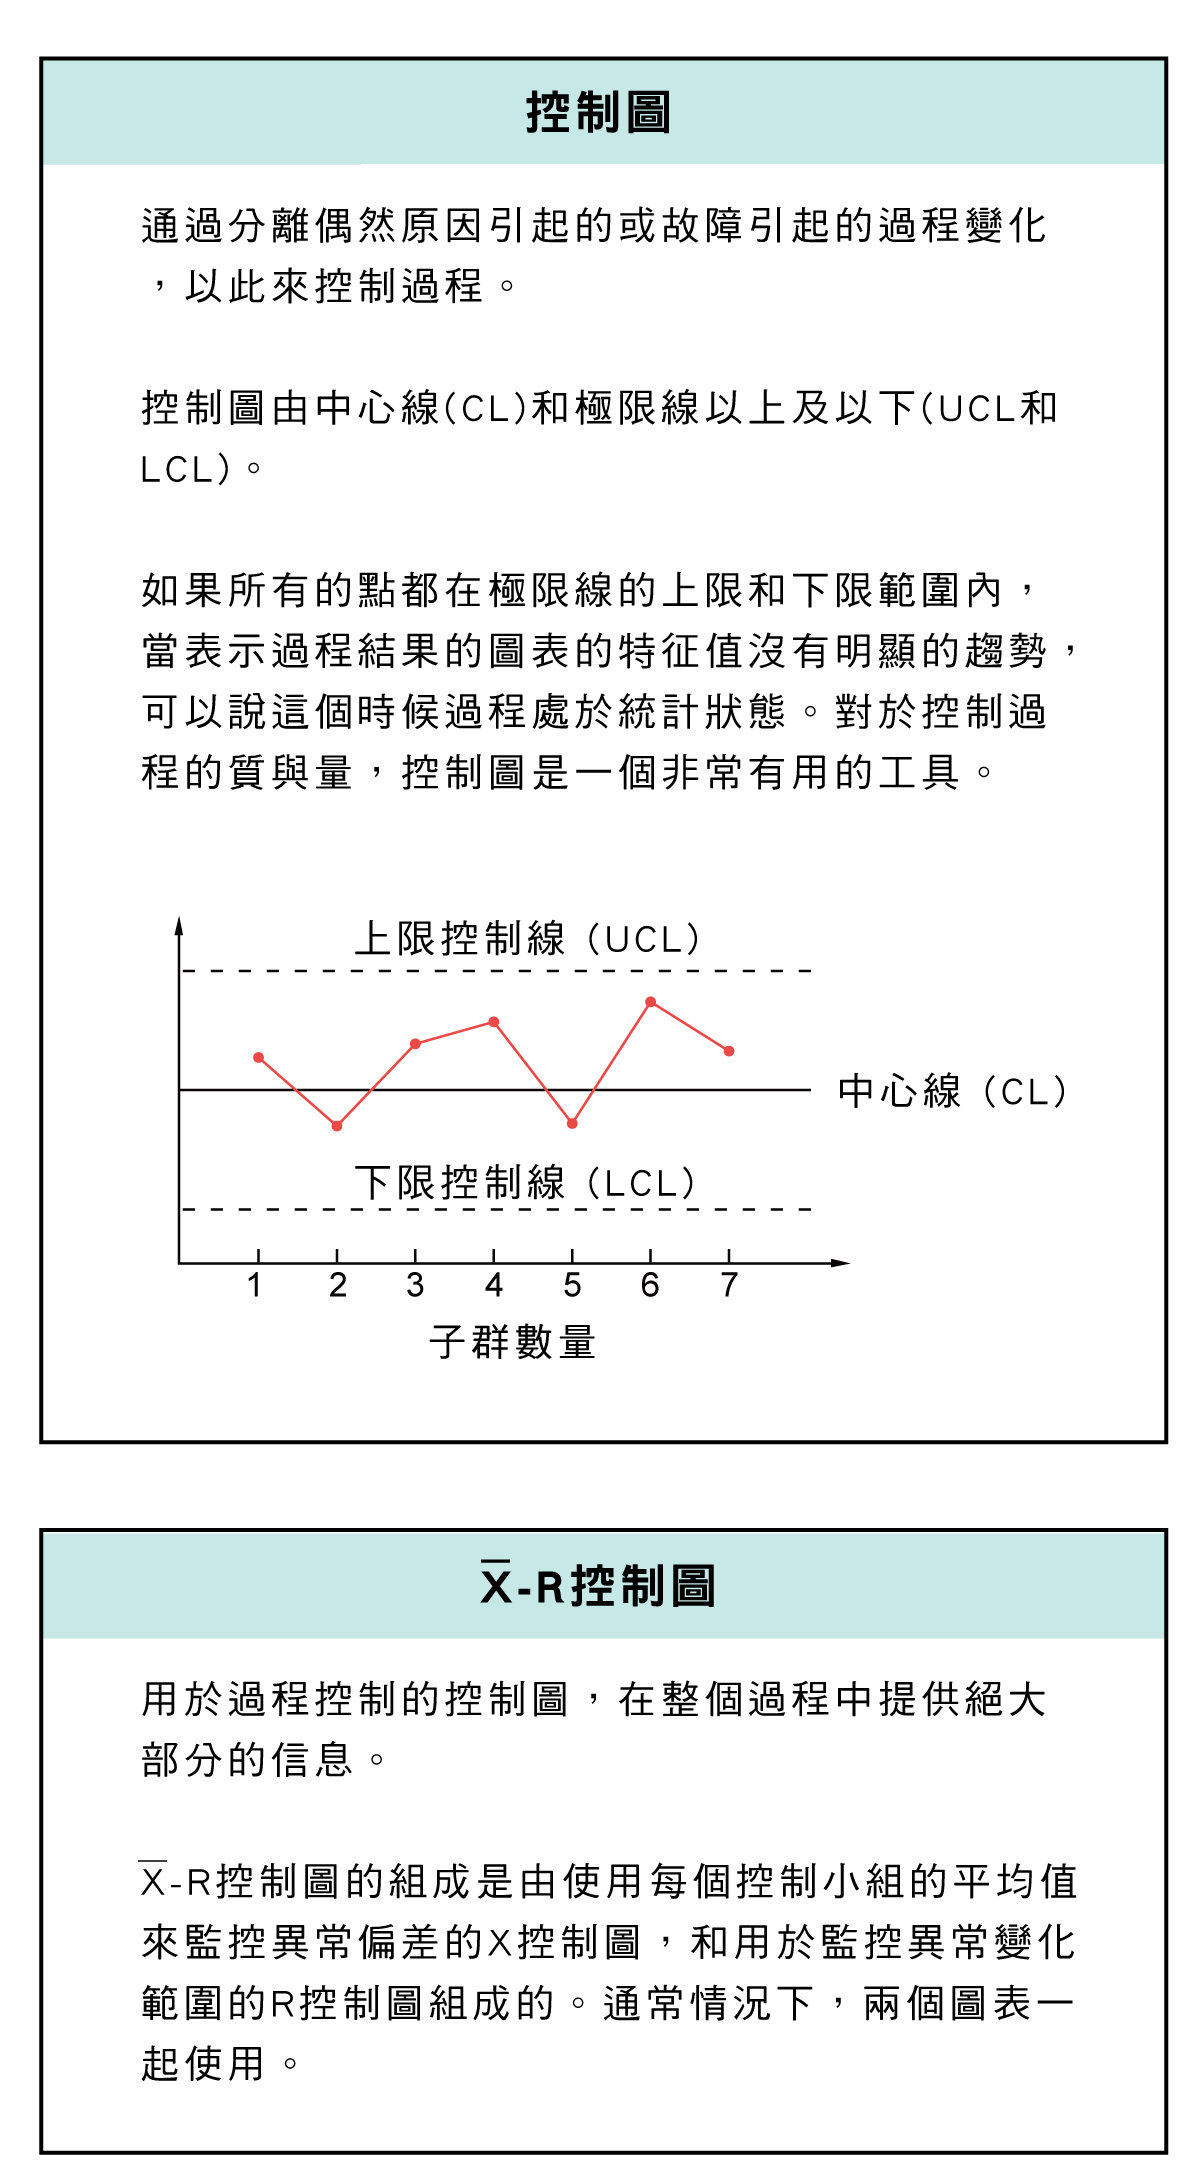
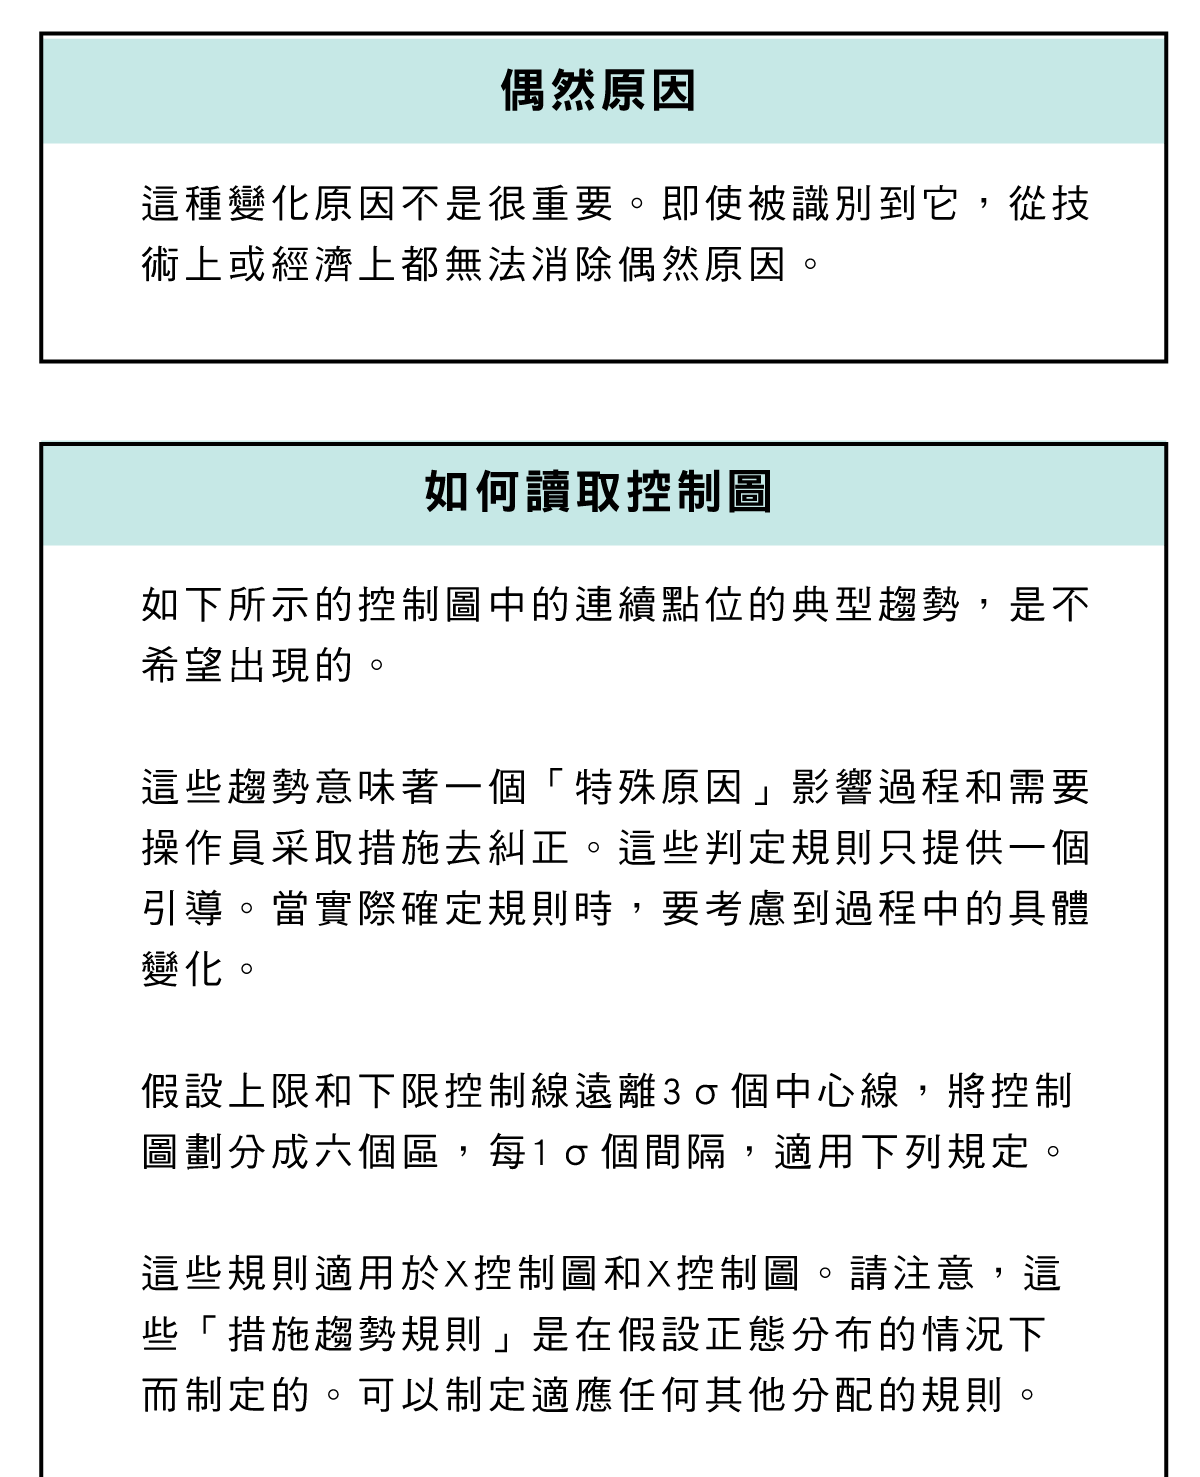
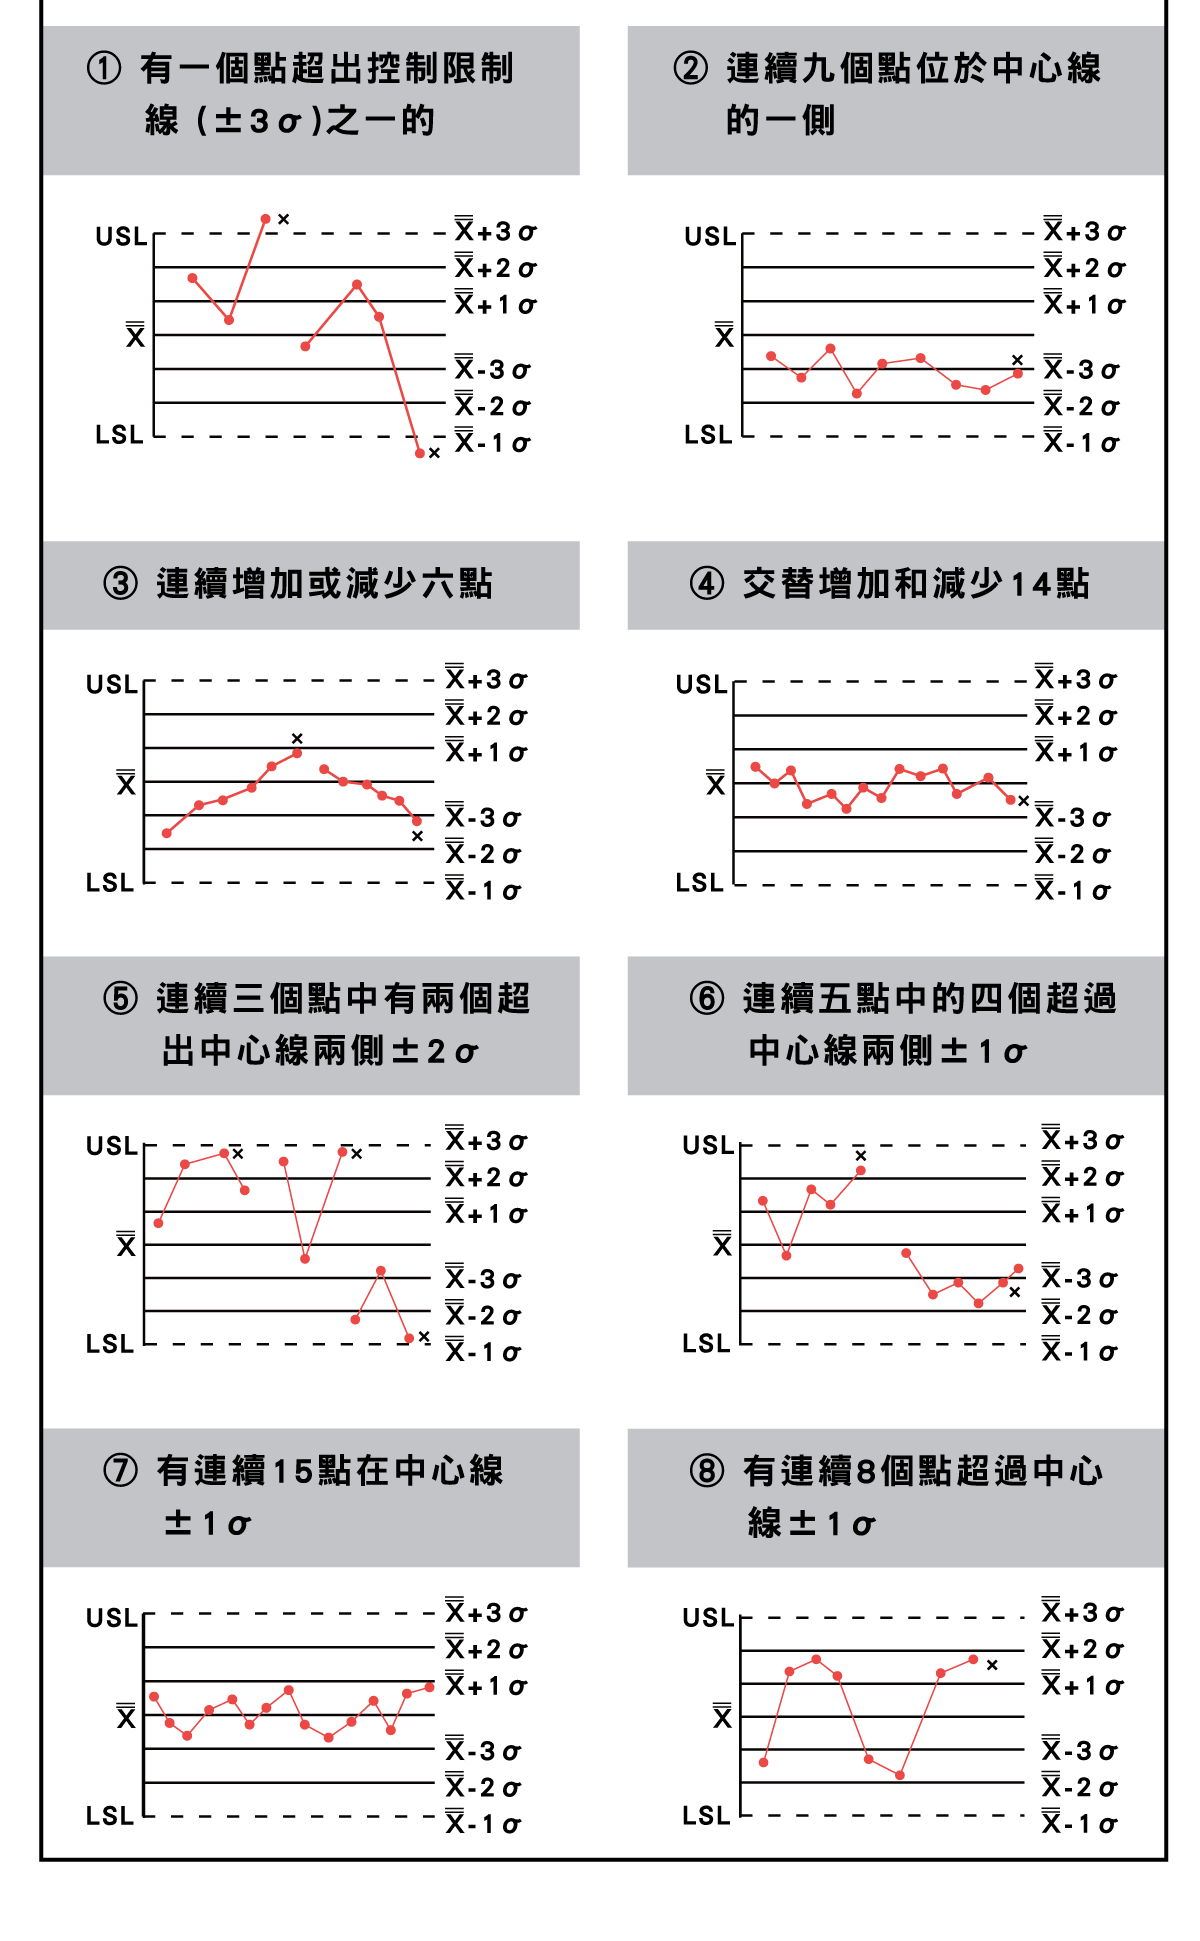
A control chart is divided into six zones at ±1σ intervals from the centre line, and the arrangement of points is tested against the following. All eight apply to both the X chart (average) and the R chart (dispersion); what makes a rule a rule is the point count, not a feeling that something looks wrong.
| Rule | What counts as an out-of-control signal |
|---|---|
| 1 | One point beyond the control limit (±3σ) |
| 2 | Nine consecutive points on one side of the centre line |
| 3 | Six consecutive points steadily increasing or decreasing |
| 4 | Fourteen consecutive points alternating up and down |
| 5 | Two out of three consecutive points beyond ±2σ on the same side |
| 6 | Four out of five consecutive points beyond ±1σ on the same side |
| 7 | Fifteen consecutive points all within ±1σ (stratification) |
| 8 | Eight consecutive points all outside ±1σ (mixture) |
These eight are one set of guidelines, not a fixed standard; which of them to apply, and with what counts, has to be decided against the inherent variation of the process itself.
8. Common vs Special Cause
Common cause: natural variation and internal fluctuation — within normal range. Special cause: equipment fault, operator error, material problem. The management focus is to find and remove special causes so the process returns to stability. For measurement bias itself, see the CMM Accuracy & Uncertainty Guide.
FAQ
Q: Cp vs Cpk?
Cp only compares distribution width to tolerance, assuming it is centred — a "potential" capability; Cpk also accounts for mean shift. If a process is off-centre, Cp may look good while Cpk is low, meaning a high real defect rate. Cpk is closer to reality for acceptance.
Q: What Cpk passes?
Common thresholds: ≥1.33 acceptable, ≥1.67 good; high-demand sectors like automotive often require 1.33+. The actual threshold depends on customer and product risk, and critical characteristics usually demand higher Cpk.
Q: What do 9 points on one side mean?
It signals a possible systematic shift (tool wear, material batch change); even within control limits it counts as an out-of-control signal to investigate. It is a common rule for detecting a special cause.
Q: Must common causes be handled?
Common cause is the process's inherent natural variation and cannot be removed one by one; over-reacting adds variation (over-adjustment). Remove special causes first, then reduce common variation by improving the process as a whole.
This article is part of Precision Measurement Complete Guide: Ask What You Are Measuring First, Then Pick the Instrument; that guide shows how the whole topic fits together.
Published: 2026-03-22 | Last updated: 2026-07-25